ProcessSpy
ProcessSpy delivers elite macOS process monitoring with advanced filtering, real-time analytics, and deep system insights.
Visit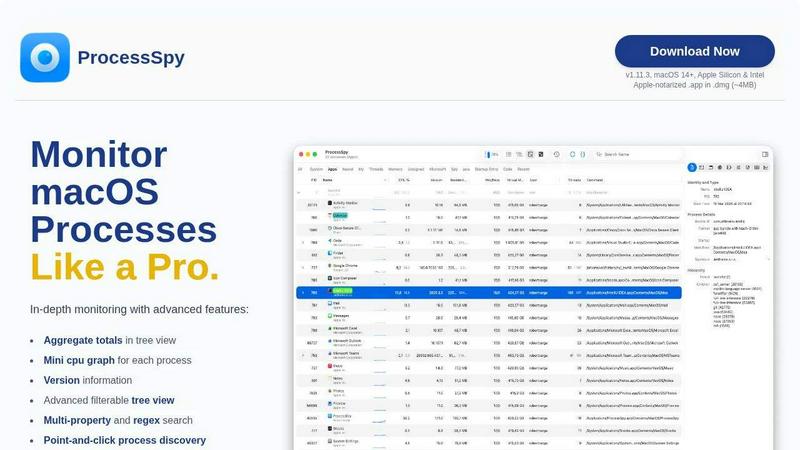
About ProcessSpy
ProcessSpy is the definitive, native process explorer and system monitor engineered exclusively for macOS. It transcends the limitations of built-in tools like Activity Monitor, offering elite developers, system administrators, and power users an unprecedented level of visibility and control over their system's inner workings. Designed as the macOS counterpart to the legendary Sysinternals Process Explorer, ProcessSpy reveals what Apple hides: intricate process hierarchies, open files and network connections, environment variables, and granular version details. Its core value proposition is delivering professional-grade diagnostic capabilities through a fast, native, and Mac-first interface, free from the bloat of cross-platform frameworks. Whether you're debugging a complex multi-process application, hunting down resource hogs, or simply needing to forcefully terminate a stubborn process, ProcessSpy provides the clarity and authority required for elite system management. It transforms opaque system activity into transparent, actionable intelligence.
Features of ProcessSpy
Advanced Hierarchical Process Tree
ProcessSpy visualizes your system's activity not as a flat list, but as a dynamic, hierarchical tree. This reveals the parent-child relationships between processes, allowing you to understand which application spawned which services or threads. Crucially, it displays aggregate totals for CPU, memory, and thread usage for entire branches, providing immediate insight into the collective resource impact of an application and all its sub-processes, a feature completely absent from native macOS tools.
JavaScript-Powered Dynamic Filtering
Move beyond basic search with ProcessSpy's advanced filtering engine. Define custom filters using JavaScript, enabling complex, multi-condition logic to pinpoint exactly the processes you need to inspect. You can filter based on any combination of process name, PID, CPU usage, command-line arguments, or start time. This programmatic approach to process discovery offers a level of precision and automation that is essential for professional troubleshooting and monitoring workflows.
Comprehensive Process Context & Inspection
Right-click any process to unlock a powerful context menu with deep inspection capabilities. Instantly view open files, active network connections, and loaded dynamic libraries (Dylibs). The paid license further expands this into elite territory, revealing environment variables, code signatures, entitlements, Info.plist contents, bundle identifiers, and launch agent/daemon status. This turns every process from a name in a list into a fully-documented entity.
Historical Recording & Forensic Analysis
With the licensed version, ProcessSpy evolves from a real-time monitor into a forensic tool. It can continuously record historical metrics for CPU, memory, and thread counts, with data exportable to CSV for analysis. Furthermore, it remembers finished processes indefinitely, preserving their command-line arguments, environment variables, and recorded history for post-mortem debugging. This creates an invaluable audit trail of system behavior.
Use Cases of ProcessSpy
Developer Debugging & Profiling
Developers can precisely identify which instance of a runtime (like Java, Python, or Node.js) belongs to which project by viewing full command-line paths and version information. Inspect environment variables for configuration issues, monitor child processes spawned by your code, and use historical recording to profile resource usage trends over time, all critical for optimizing and debugging complex applications.
System Administration & Security Auditing
System administrators gain the tools for rigorous system audits. Discover hidden launch agents or daemons, verify code signatures and entitlements of running processes, and inspect all open network connections. The ability to flag and remember new processes provides immediate visibility into unexpected system changes, aiding in security monitoring and compliance checks.
Performance Troubleshooting & Resource Management
Quickly identify resource bottlenecks by using the tree view with aggregate totals to see which application family is consuming excessive CPU or memory. Use advanced filters to isolate processes with specific resource patterns. The mini CPU graph per process and detailed history recording allow you to pinpoint the exact moment and cause of performance degradation.
Forceful Application & Process Management
When applications hang or become unresponsive, Activity Monitor often fails to provide enough detail for a clean termination. ProcessSpy allows you to definitively identify every related process, sub-process, and open file handle. You can then kill an entire process tree with certainty, ensuring a complete cleanup and freeing locked resources without requiring a system restart.
Frequently Asked Questions
Is ProcessSpy safe to install on my Mac?
Absolutely. ProcessSpy is meticulously crafted for macOS security standards. It is Apple-notarized and distributed as a cryptographically signed application inside a DMG disk image. This guarantees the software has been checked by Apple for malicious content and has not been altered, making it safe for use on both Intel and Apple Silicon Macs.
What versions of macOS are supported?
ProcessSpy is designed for the modern macOS ecosystem, requiring macOS 14 (Sonoma) or newer. It is fully compatible with the latest macOS 26 (Tahoe) and is optimized to leverage native APIs on both Apple Silicon and Intel architectures for peak performance and integration.
What is the licensing model for the advanced features?
A one-time license fee of $24.99 unlocks all advanced paid features permanently. This license is per user and covers unlimited personal devices. It includes lifetime access to all future updates and new features, representing a significant long-term value for professionals who require deep system insight.
How does ProcessSpy compare to the built-in Activity Monitor?
ProcessSpy is a specialized, professional-grade tool that exposes layers of detail Activity Monitor deliberately hides. The comparison table highlights key differentiators: full command-line visibility, process version/path distinction, hierarchical aggregate totals, multi-property regex search, and a suite of advanced inspection features (entitlements, environment variables, history recording) that are simply unavailable in the native utility.
Similar to ProcessSpy

JustLaunched
The launch platform for indie makers — schedule your launch, get in front of buyers, and blast across directories.