VolRadar
VolRadar delivers elite daily options analytics so premium sellers identify top volatility setups in thirty seconds.
Visit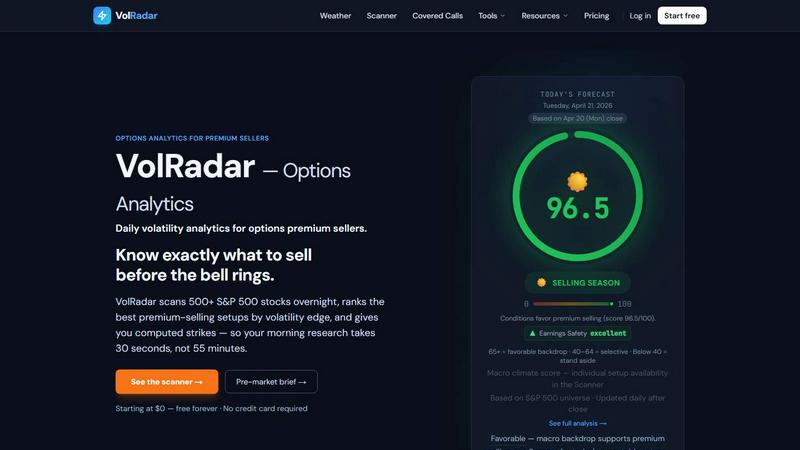
About VolRadar
VolRadar is a premier daily options analytics platform engineered specifically for premium sellers who trade iron condors, credit spreads, cash-secured puts, and the wheel strategy on S&P 500 names. This elite tool transforms the complex landscape of options volatility into actionable intelligence, delivering a pre-market brief every morning before the opening bell. By pulling end-of-day options data from ORATS after the US market close and running it through sophisticated proprietary models, VolRadar ensures that by the time you sit down with your coffee, you already know exactly which tickers are worth selling premium on and which ones to skip entirely. The platform scans over 500 US stocks and major ETFs nightly, ranking them by volatility edge and providing computed strikes so your morning research takes 30 seconds instead of 55 minutes. VolRadar is designed for the serious options trader who demands institutional-grade data from CBOE and S&P 500 sources, combined with a clean, intuitive interface that distills complex metrics into a single Weather Score from 0 to 100. Whether you are a seasoned professional or an ambitious retail trader, VolRadar elevates your decision-making process by removing guesswork and replacing it with data-driven precision. The platform covers seven strategy types and five Weather Score factors, updated daily after the close, making it the definitive tool for anyone serious about consistent premium collection in the US equity options market.
Features of VolRadar
Weather Score
The Weather Score is VolRadar’s flagship composite metric, a single number from 0 to 100 that instantly tells you whether today favors selling premium. This score aggregates five critical factors: Premium Edge, VIX level, Volatility Trend, Earnings Safety, and Term Structure. A score of 65 or above signals favorable conditions for broad premium selling, 40 to 64 indicates selective opportunities where careful stock picking is required, and below 40 suggests a defensive posture where standing aside is prudent. This feature eliminates the need to juggle multiple indicators, giving you a clear macro climate assessment at a glance.
IV Rank with 252-Day Lookback
VolRadar provides Implied Volatility Rank calculated over a 252-day lookback period on 30-day at-the-money implied volatility. This metric tells you where current IV stands relative to its historical range, enabling you to identify when options are expensive or cheap relative to recent history. For premium sellers, high IV Rank signals that options are overpriced, creating favorable conditions for selling strategies. The platform surfaces stocks with elevated IV Rank daily, with the current environment showing 351 stocks meeting high IV criteria, allowing you to pinpoint the most profitable opportunities.
Volatility Risk Premium (VRP) Analysis
The VRP feature calculates the difference between 30-day implied volatility and 20-day realized volatility, expressed in percentage points. A positive VRP indicates that options are pricing in more volatility than what has actually occurred, creating a statistical edge for premium sellers. VolRadar currently identifies 479 stocks with positive VRP, giving you a vast universe of candidates where the market is overpaying for volatility. This metric is essential for identifying trades where you are being compensated with excess premium relative to actual risk.
Computed Strikes and Strategy Builder
VolRadar’s Strategy Builder takes the guesswork out of trade construction by computing precise strike prices based on your target delta or target credit. Once you select a ticker, the platform pre-fills strikes for multiple strategies, including short puts, iron condors, and covered calls, complete with P&L estimates, breakeven points, and maximum loss parameters. This feature allows you to go from stock selection to a fully structured trade in seconds, with ranked strategy suggestions showing the best setups first, such as a short put with $1.85 credit or an iron condor with $2.10 credit.
Use Cases of VolRadar
Morning Pre-Market Briefing
The primary use case for VolRadar is the daily pre-market briefing. After the US market close at 6 PM ET, the platform pulls fresh ORATS data, runs it through models, and generates a concise morning report. By the time you sit down to prepare for the trading day, you receive the Weather Score, top candidate tickers sorted by volatility edge, and key changes in market conditions such as strong signals, positive VRP stocks, and high IV stocks. This use case eliminates the need for hours of manual screening, allowing you to focus on execution.
Identifying Earnings Crush Opportunities
VolRadar is exceptionally valuable for traders who target earnings crush strategies. The platform provides per-ticker IV collapse data post-earnings announcement, showing how implied volatility contracts after the event. By identifying stocks where IV is about to collapse, premium sellers can position short options strategies to capture the rapid decline in option prices. This use case is particularly powerful during earnings season when dozens of S&P 500 names report weekly, and VolRadar’s earnings safety factor helps you avoid stocks with unpredictable earnings outcomes.
Covered Call and Wheel Strategy Screening
For traders running covered calls or the wheel strategy, VolRadar’s scanner and analytics provide a systematic way to identify optimal candidates. The platform ranks stocks by premium edge, IV Rank, and VRP, allowing you to select names where you can collect maximum premium while maintaining reasonable downside risk. The covered call screener specifically filters for stocks with elevated implied volatility relative to realized volatility, ensuring you are selling calls that are overpriced. This use case is ideal for income-focused investors managing portfolios of S&P 500 names.
Risk Management and Market Timing
VolRadar serves as a critical risk management tool by providing the Weather Score and macro climate assessment. When the score falls below 40, the platform effectively tells you to stand aside and avoid selling premium, protecting your capital during unfavorable conditions. Conversely, when the score is above 65, you can confidently deploy premium selling strategies across multiple candidates. This use case helps traders avoid the common pitfall of forcing trades in poor market environments, aligning your trading activity with statistical probabilities.
Frequently Asked Questions
What data sources does VolRadar use for its analytics?
VolRadar uses institutional-grade data from ORATS, CBOE, and S&P 500. End-of-day options data is pulled from ORATS after the US market close, while volatility indices and underlying stock data come from CBOE and S&P 500. This combination ensures that all calculations are based on accurate, reliable, and timely market data, giving you confidence in the analytics provided.
How often is the data updated on VolRadar?
Data is updated daily after the US market close, typically around 6 PM ET. The platform pulls fresh ORATS data, runs it through proprietary models, and generates the pre-market brief and updated scanner rankings. This daily cadence ensures you always have the most current information for the next trading day, without intraday noise that can distort volatility metrics.
What is the Weather Score and how should I use it?
The Weather Score is a composite metric from 0 to 100 that aggregates five factors: Premium Edge, VIX level, Volatility Trend, Earnings Safety, and Term Structure. A score of 65 or above indicates favorable conditions for selling premium broadly across top candidates. Scores between 40 and 64 suggest selective trading where you should focus on individual setups. Below 40 signals defensive conditions where standing aside is recommended. Use it as your first filter before diving into specific tickers.
Can I use VolRadar for intraday trading or only for end-of-day analysis?
VolRadar is designed for end-of-day analysis and pre-market preparation. The platform processes data after the US market close and delivers results before the next trading day opens. While you can use the insights to inform intraday trading decisions, the analytics are based on daily closing data and are optimized for swing trades, weekly options, and multi-day premium selling strategies rather than intraday scalping.
Pricing of VolRadar
VolRadar offers a tiered pricing structure designed to accommodate traders at every level. The Free tier provides access to the Weather Score, four calculators, and a basic scanner with no credit card required. For traders seeking deeper analytics, the Starter plan at $19 per month unlocks the full scanner covering all 500+ tickers, the daily pre-market brief, computed strikes, and weekly trade ideas. This pricing structure ensures that casual users can benefit from the platform’s core insights while serious premium sellers gain access to the comprehensive toolset needed for professional-grade options trading.
Similar to VolRadar

Bullynx
Bullynx is your elite AI trading copilot that analyzes charts and answers market questions in seconds.
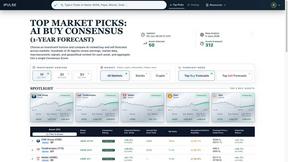
iPulse
iPulse delivers elite AI market intelligence with precise forecasts, real-time signals, and actionable risk insights for discerning investors.
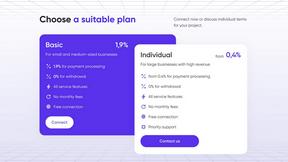
TryBit
TryBit is the elite crypto payment gateway empowering global merchants to seamlessly accept over 40 cryptocurrencies with ultra-low fees and.

helpdol
Helpdol transforms messy finances into clarity by letting you track expenses, forecast cash flow, and manage receipts with voice commands.

Postservice.at
Secure your prestigious legal business address in Vienna’s prime 1010 district with instant activation and digital mail handling from 49 euros.
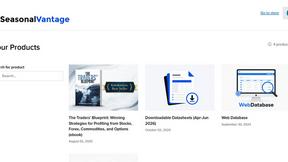
SeasonalVantage
Unlock elite trading precision by combining high-probability seasonal data with curated options flow to confirm smart money moves.

PipelineGrader
Audit your B2B pipeline instantly with no signup, getting prioritized actions to fix revenue leaks.
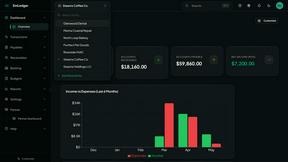
EmLedger
EmLedger delivers unified multi-entity accounting with real double-entry across all your businesses for one flat fee, not per-entity charges.