
Chart Echo
Chart Echo instantly finds historical chart patterns matching your current setup and reveals how they played out before.
Visit
About Chart Echo
Chart Echo is a precision analytical tool designed for the discerning trader and investor who demands empirical evidence over market speculation. This platform fundamentally redefines how market participants interact with historical data by performing an exhaustive search across approximately 450 million historical windows to identify chart patterns that mirror the exact setup currently on your screen. The core philosophy is elegantly simple: markets move in recurring patterns, and understanding how those patterns resolved previously provides a distinct informational advantage. Chart Echo is not a predictive oracle or a source of financial advice; it is a sophisticated memory engine for the markets, presenting users with data-grounded outcome statistics including probability distributions, average moves, and typical drawdowns. The tool serves a diverse audience ranging from active traders seeking confirmation on short-term setups to long-term investors validating breakout or sell-off scenarios against decades of precedent. Crypto enthusiasts will find particular value in the platform ability to match assets like Bitcoin and Ethereum against their own historical structures and across other major cryptocurrencies. The user experience is intentionally streamlined through a guided five-step flow that eliminates the noise of traditional charting platforms, requiring no indicator configuration, custom scripts, or complex scanners. Chart Echo delivers one clear answer to one clear question: what happened before when the market looked exactly like this.
Features of Chart Echo
Massive Historical Pattern Database
Chart Echo searches approximately 450 million historical windows across stocks and cryptocurrencies to find patterns that match your current setup. This exhaustive database covers decades of market data, ensuring that every search yields statistically significant results. The matching algorithm evaluates shape similarity with mathematical precision, ranking each historical echo by how closely it rhymes with your pattern. This depth of historical context transforms subjective chart reading into an objective, data-driven exercise where every decision is informed by real precedent rather than anecdotal memory.
Real-Time Pattern Overlay and Continuation Analysis
The platform overlays historical matches directly onto your current chart in a distinct gold color, allowing for immediate visual comparison between past and present patterns. More importantly, Chart Echo shows you what happened after each historical match occurred, aggregating these continuations to present honest outcome statistics. Users can see precisely how often similar setups rose, fell, or went nowhere, along with the average move magnitude and typical drawdown experienced along the way. This feature transforms abstract pattern recognition into actionable intelligence with quantifiable probabilities.
Guided Five-Step Workflow
The application employs a structured five-step process that eliminates the ambiguity of traditional chart analysis. Users begin by selecting their market asset, then define the timeframe and pattern length before running the search. The platform returns a ranked list of historical echoes with similarity scores and specific reasons for each match. Users can overlay individual matches, study outcome statistics, and then take action by saving workspaces, setting reminders, or sharing findings. This guided flow ensures that even novice users can access sophisticated pattern matching without technical expertise.
Mobile-Optimized Experience and Sharing Capabilities
Chart Echo extends its functionality to mobile devices with a fully guided experience designed for checking setups away from the desk. The platform enables users to save workspaces for future reference, set reminders for favorite charts that print strong fractal projections, and receive notifications when setups align with historical precedents. Sharing capabilities include exporting chart matches as GIFs and images for collaboration with peers or for personal record-keeping. This mobile integration ensures that critical market insights remain accessible regardless of location or device.
Use Cases of Chart Echo
Pre-Trade Pattern Validation for Active Traders
Before committing capital to a trade setup, active traders can leverage Chart Echo to examine the closest historical analogs to their current pattern. The platform reveals how those similar setups resolved over the following days and weeks, presenting odds of success, average move expectations, and typical drawdown risks. This empirical validation transforms discretionary trading decisions into statistically informed actions, allowing traders to enter positions with a clear understanding of historical precedent rather than relying solely on pattern recognition or intuition.
Long-Term Investment Decision Support
Long-term investors can use Chart Echo to sanity-check breakouts or sell-offs against decades of market precedent rather than depending on a single analyst opinion or news headline. When evaluating whether a stock breakout has legs or a sell-off represents a capitulation low, the platform provides historical context spanning thousands of similar structural formations. This data-driven approach helps investors distinguish between genuine trend changes and noise, framing critical portfolio decisions within the broader context of market memory.
Crypto Market Structure Analysis
Cryptocurrency markets exhibit particularly strong pattern repetition, making Chart Echo especially valuable for crypto traders and investors. Users can match Bitcoin, Ethereum, and other major cryptocurrencies against their own historical price structures and across different assets to identify where current formations have occurred before. This cross-asset comparison provides unique insights into crypto market behavior, helping users navigate the extreme volatility and structural patterns characteristic of digital asset markets.
Educational Pattern Recognition Study
Traders and investors seeking to improve their chart reading skills can use Chart Echo as an educational tool to study how specific pattern types have historically resolved. By repeatedly analyzing matches and their continuations, users develop an intuitive understanding of pattern probabilities and market behavior. The platform serves as an interactive textbook where every chart tells a story of what happened before, accelerating the learning curve for those serious about mastering technical analysis through empirical observation rather than theoretical study.
Frequently Asked Questions
How does Chart Echo find matching chart patterns?
Chart Echo uses a proprietary fractal matching algorithm that analyzes the shape of your current chart pattern and searches across approximately 450 million historical windows. The algorithm evaluates geometric similarity between your pattern and every historical segment in its database, ranking matches by how closely they align. Each match includes a similarity score and explanation of why the pattern rhymes, allowing users to understand the basis for each comparison.
Is Chart Echo a predictive tool or financial advice?
Chart Echo is explicitly neither a prediction tool nor a source of financial advice. The platform presents historical data showing how similar chart patterns resolved in the past, but it does not claim that future outcomes will repeat. The value lies in providing empirical precedent so users can make their own informed decisions. All outcome statistics represent historical performance only, and users should always conduct their own research before making trading or investment decisions.
What assets does Chart Echo support?
Chart Echo supports both stocks and cryptocurrencies, covering a broad range of major assets. Users can search for popular stocks and crypto tickers directly or browse starting points within the application. The database includes decades of historical data across these asset classes, enabling cross-asset pattern matching where relevant. The platform continues to expand its asset coverage to include additional markets over time.
Can I use Chart Echo without creating an account?
Yes, Chart Echo offers free access with no account required for basic functionality. Users can immediately search for chart patterns and view historical matches without signing up. Creating an account unlocks additional features such as saved workspaces for future reference. Premium subscriptions add advanced capabilities including Pro Mode, saved-setup reminders, intraday timeframes, real-time alerts, and watermark-free exports for professional use.
Similar to Chart Echo

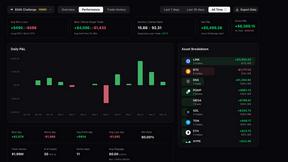
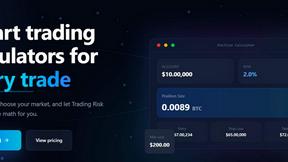
Trading Risk Lab
Trading Risk Lab delivers elite precision with smart calculators to size positions and manage risk, transforming guesswork into disciplined.
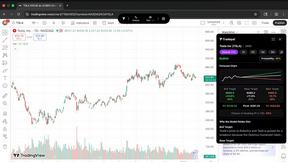
Tradepal
Tradepal empowers traders with AI-driven stock analysis, delivering real-time insights, forecasts, and personalized.
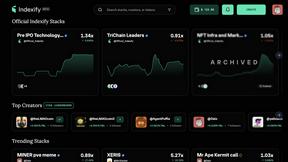
Indexify
Indexify enables effortless crypto portfolio management on Solana by following expert strategies and curated Stacks.
PipBack
PipBack helps prop traders save money through exclusive discounts and real cashback on trading challenges.