Fusedash vs Plottie
Side-by-side comparison to help you choose the right tool.
Fusedash turns your raw data into clear dashboards and charts so your team can act on insights instantly.
Plottie effortlessly transforms your data into stunning, publication-ready scientific figures in seconds, no coding.
Last updated: February 28, 2026
Visual Comparison
Fusedash

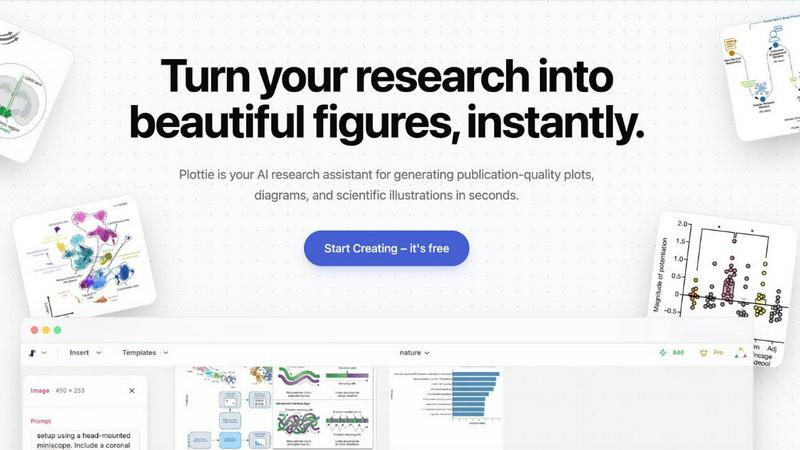
Plottie
Overview
About Fusedash
Fusedash is an AI-powered data visualization platform designed to help teams transform their connected data into clear, actionable insights. It acts as a unified workspace where you can create decision-ready dashboards, interactive charts, detailed maps, and narrative reports without the need to rebuild the same logic across multiple, disconnected tools. The core value proposition is consistency and efficiency: you define your key metrics and KPIs once, and then reuse those consistent definitions across every view and report. This ensures everyone in the organization—from leadership to marketing to operations—is looking at the same trusted numbers. Fusedash is built for teams that are tired of manual reporting cycles and conflicting data stories. It empowers users to not only monitor what's happening through real-time interfaces but also to understand why it's happening by drilling down into segments, regions, or time periods. With integrated AI features like natural language data chat and smart visualization assistance, Fusedash makes data exploration and reporting faster and more accessible, turning raw data into a shared source of truth that drives alignment and action.
About Plottie
Plottie is an innovative, AI-powered scientific figure platform that empowers researchers, students, and academics to create publication-quality visualizations effortlessly. With a rich database of over 100,000 meticulously curated plots sourced from prestigious open-access journals, Plottie serves as a vital resource for those in the scientific community. Its intelligent AI editor allows users to generate high-quality figures from scratch, utilizing plain language to describe their needs. This unique feature eliminates the need for complex coding or expensive software licenses, making it accessible to everyone, regardless of technical expertise. Trusted by researchers at leading institutions such as Stanford, MIT, and Harvard, Plottie simplifies the often tedious process of transforming raw data into compelling visual stories. Whether you are preparing a grant proposal, crafting a conference poster, or writing a research paper, Plottie provides a seamless, single workspace for discovering, creating, and refining scientific visualizations, all while maintaining a focus on precision and clarity.